
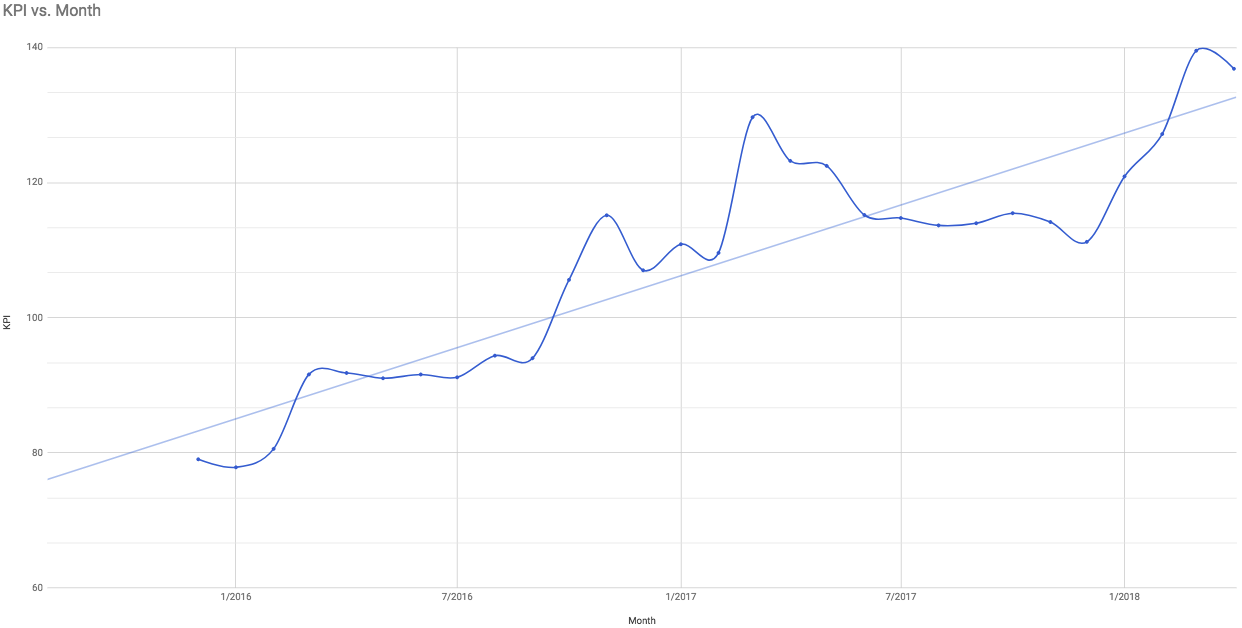
Last year, I shared a new KPI that we were piloting — the content efficiency metric.
This is a metric that measures how much our audience uses our content, in relationship to the amount of content we are spending time and energy maintaining.
Our hope was that the KPI would help guide our work choices in a handful of areas:
- Keep the number of pieces of content that we manage down.
- Jettison low-performing content.
- Update existing content so it performs better.
- Avoid adding too much content without deleting an equal number of low performers.
In the last quarter, the KPI trended upward. That means the amount of content we were creating was holding fairly steady, while usage of the content by both web visitors and our call center agents was increasing.
That’s the sweet spot that we’re trying to hit every month. We want our content team producing and updating highly useful content, not spending time maintaining content that our audience doesn’t need or want.
Here are some things the KPI helped us analyze in the last several months:
- A small content clean-up in December led us to delete several duplicative pieces of content, which meant the team had fewer articles to maintain.
- We’ve been slowly adding new videos and infographics to our site, but have continued to steadily delete low-usage content. That means these new content additions aren’t negatively impacting our efficiency.
- In March, both web visits and contact center use of our content soared, leading to the highest content efficiency KPI to date.
- Visits to GobiernoUSA.gov are steadily increasing, which we think is because of the work we’ve done to make our Spanish-language content more usable and findable.


_v003.png)