
Journey maps are a visual representation of a customer’s end to end journey with your product or service. They are a powerful tool for exploring key interactions and experiences with your organization, programs, and/or services.
Journey maps describe a customer’s entire journey, even the parts that occur before and after contact with your organization. They typically contain elements such as the customer’s attitudes, emotions, and needs.
We recently updated USA.gov’s personas and used them as the backbone for our journey maps. We updated our personas to help inform our Web design, content, and contact center services.
We have a lot of data that we regularly analyze, and it tells us a lot about our customers’ journeys within a channel, but we knew we needed to better understand our customers’ journeys across channels. This is a best practice to better understand what a customer experiences, where there are disconnects in information, and where improvements can be made to your website, contact center interactive voice response recordings, or service delivery on any channel.
Preparation is Key
We used information in the CX Journey Mapping Toolkit to plan the sessions and our approach. We invited subject matter experts, managers, and other stakeholders to participate in the mapping sessions and designated facilitators to lead the sessions and keep us on track.
One of the most important preparation activities is creating the behavior line. This is the path your customer takes and the journey you’re going to map.
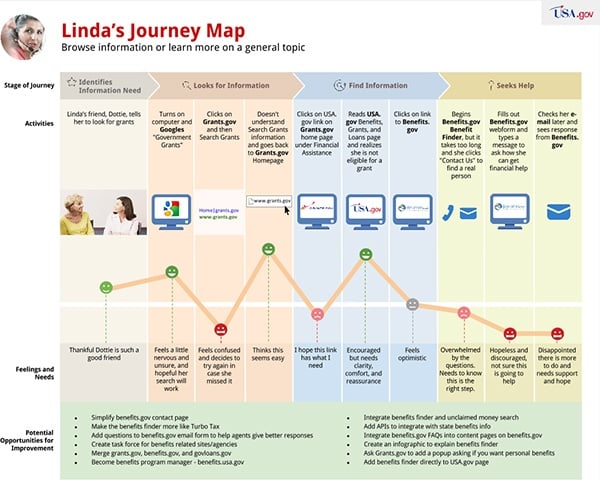
One of USA.gov’s personas, Linda, wants to browse information or learn more on a general topic. We selected “searching for financial assistance from the government” as the topic of Linda’s journey because it’s consistently one of the top reasons customers visit USA.gov or call 1-844-USA-GOV1, and it falls within the persona category.
To create Linda’s behavior line, we looked at:
- USA.gov Web analytics, including demographics, devices, common paths, popular pages, outbound links, and onsite searches
- Web analytics specifically for our Government Benefits, Grants, and Loans content
- USA.gov customer satisfaction survey data
- Searches on Google that led customers to USA.gov
- Contact center content usage
- Web analytics for other government websites available through the Digital Analytics Program
- General search trends on Google
Once the behavior line was created, we printed each step on one piece of paper. We taped the steps to the wall, with accompanying images, and the facilitators walked the participants through a series of exercises to explore the journey, which includes:
- Employees and systems the customer interacts with personally
- Behind-the-scenes employees and systems that support the direct interactions
- Customer’s attitudes, emotions, and needs
- The highs and lows of the journey
After adding multiple rounds of sticky notes and stickers to mark these different factors, we picked the greatest pain points in the journey and brainstormed ways to improve them.
Results
The four journey mapping sessions generated a total of 110 ideas. Of those ideas, 58 were broad, and many were repeated in each session. Clear themes emerged around areas such as:
- Content
- Partnerships
- Marketing
- Research
- Technology
- Contact center operations
The journey mapping process and results helped us clearly see the pain points and gaps in the customer’s experience, including channel, content, and device gaps. It also helped to build empathy and increase understanding with our employees.
Next Steps and Key Takeaways
While the process of journey mapping is enlightening, it doesn’t end with a map. Follow-up and planning for improvement are key. We’ve incorporated many outcomes from our journey maps into our customer experience (CX) improvement queue. We’ve prioritized several projects into our fourth quarter objectives and key results across our content, user experience, performance measurement, and contact center teams.
Some specific priorities in our CX improvement queue:
- Improve our contact center interactive voice response (IVR) menu
- Engage partner agency customers in journey mapping exercises that cross our programs
- Share our data; make better linkages in results that impact our programs (e.g., search results impact on user experience, content usage on Web and in contact center)
- Improve reporting of key results throughout our organization and to senior leadership
- Improve customer understanding by using personas and journey maps as a standard process that we incorporate into the beginning of any new project or product
- Establish a Customer Advisory Council that includes our agency customers; engage them in our USA.gov transformation efforts and problem solving
Journey mapping isn’t a one-and-done project. We are continuing to analyze our results and prioritize areas for improvement, and we’ll continue to map future state journeys to help define desired experiences, keeping the customer at the center of our efforts.
Michelle Chronister and Mary Ann Monroe lead the USAGov Customer Experience Team.
This post first appeared on the DigitalGov blog.


.png)