Every quarter, the Analytics team provides a summary of various performance metrics on our different channels. Here are overall trends from the first quarter (Q1) of FY18.
Web Metrics
Overall Traffic
October and November 2017 could not compete with the presidential election highs of the same time last year. However, traffic in December 2017 was 19% higher on USA.gov and 3% higher on Gobierno.USA.gov as compared to December 2016.
Popular Topics or Directory Records Included
- USA.gov: voting and elections, green cards, and directory records for the U.S. Postal Service and the Department of Defense
- Gobierno.USA.gov: green cards, unemployment benefits, enlisting in the armed services, food assistance, and directory records for the State Department and Department of Labor.
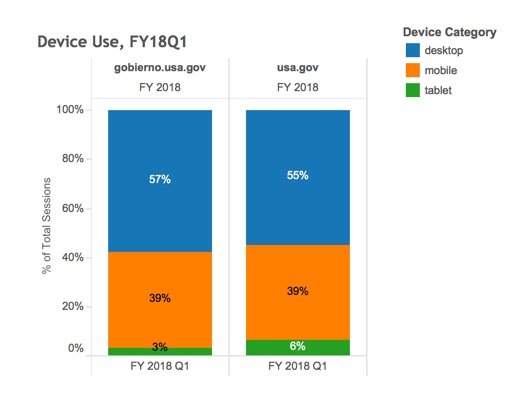
Mobile Use
- USA.gov: 39% (6% increase over 2-year span)
- Gobierno.USA.gov: 39% (18% increase over 2-year span)
Traffic Sources
- USA.gov: 71% of traffic came from search. In FY18Q1, USA.gov pages showed up in Google search results 732 million times with an average click-through rate (CTR) of 3.7%.
- Gobierno.USA.gov: 48% of traffic was categorized as Direct and 41% was from search. In FY18Q1, Gobierno.USA.gov pages showed up in Google search results 7 million times with an average CTR of 6%.
Decommissioning of Publications.USA.gov
Publications.USA.gov was decommissioned on December 20, 2017. The site had about 36,000 visits in FY18Q1.
Contact Center
While Contact Center touchpoints were down in multiple areas during FY18Q1, the addition of Login.gov as a customer agency contributed to an overall touchpoint increase of 4% as compared to FY17Q1.
The following increases/decreases are based on comparisons between FY17Q1 and FY18Q1:
- Calls: increased 3%
- Chats: decreased 18%
- Emails: decreased 11%
- Postal mail: decreased 40%
- Interactive Voice Response (IVR) self-service: increased 15%
Customer Satisfaction
USAGov uses the Government Customer Experience Index (GCXi), which is based on a scale of -100 to 100.
USA.gov
- USA.gov had a very small drop in satisfaction (67) and task accomplishment (37) in FY18Q1 versus the previous quarter. Passports and Contact Elected Officials aren't dominating the survey like they used to, which is contributing to the decrease.
- Immigration and Post Office Issues dropped for the second quarter in a row.
- Complaints and Scams were down.
- Looking for a Job was up.
GobiernoUSA.gov
- Last quarter, Gobierno set a record for satisfaction. This quarter, satisfaction is still very high (84), but task accomplishment is the lowest that it's been awhile (32).
- Quarter to quarter drops occurred on the Home Page, Entering the U.S., and Foreign Trade.
- Consumer Protection was up.
Phone had its third down quarter in a row (75 satisfaction, 64 task accomplishment).
Chat dropped in Q1 after a half year of improvement (51 satisfaction, 38 task accomplishment).
Email went up for the second quarter in a row (36 satisfaction, 24 task accomplishment).
For the sake of accountability and transparency, we hope to share these summaries each quarter in FY2018.